Smart networking is good use - the logistics London startup "Shutl" noticed at some point in the early 2010s that the relational database system used to calculate the routes of its vehicles became too slow for certain calculations.
The longest calculation took the same amount of time as the shortest trip, about 15 minutes. For a company that was committed to delivering within 90 minutes, this was not a sustainable state of affairs.
Switching to a graph database reduced the algorithm's runtime to an average of 1/50th of a second, or 20 milliseconds. This is 45000 times faster compared to the longest query.
In July 2010, Google announced that it would acquire Metaweb. Metaweb operated a knowledge database called Freebase, which stored millions of entries drawn from Wikipedia and the music database MusicBrainz, among others, and was continuously supplemented and further networked by a user community.
Then, under the motto "things, not strings," Google announced the "Knowledge Graph" on May 16, 2012, which relied in part on the content of Freebase. In addition, the data from Freebase was passed on to WikiData.
Google's Knowledge Graph is used in particular in the so-called "Knowledge Panels"; these are the "boxes" that sometimes appear on the results pages and supplement search results for people, companies or institutions ("named entities") with structured information. The panels often contain a brief description, tabular, linked basic information, and - under the heading "Others also searched for" - links to contextual information on Google's search pages, such as similar companies, institutions, or other people relevant in the search context.
In these two very different use cases, there is a lot of talk about graphs and graph databases, which leads to the question:
What is a graph anyway?
In mathematics, a graph is said to exist when objects and the connections between them are represented by a set of so-called nodes (objects) and edges (connections). The edges can have a direction, but do not have to. A few examples of graphs are the schematic representation of molecules, taxonomies in biology, network maps in public transport or the representation of the syntactic structure of a sentence. From these examples it becomes clear that the nodes of a graph can represent abstract concepts, such as the nominal phrase of a sentence. And it also becomes clear that the connections, the edges are extremely important for the overall meaning of the graph.
Graph databases simply explained - it's always about the relationships
A graph database is able to store and efficiently query large graphs with millions of nodes and edges. This is what makes projects like the ones mentioned at the beginning possible in the first place. Google is not the only major player to operate a knowledge graph - Apple does too (for the world knowledge that Siri draws on), and Amazon announced its own knowledge graph called "Alexa Entities" early last year.
Many computations and queries that can be performed with graph databases can be described as variants of a single operation: navigating within the graph's relational structure. Whether you call this "pattern matching" or "traversal", it ultimately always boils down to finding nodes and the paths between them according to certain criteria.
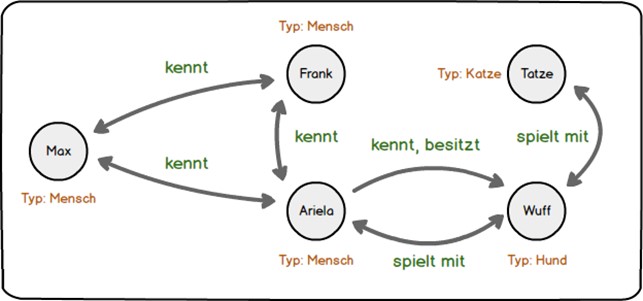
The small example graph here may clarify this:

For the sake of clarity, this graph describes people and pets. The nodes, the directed edges and last but not least the properties of the two are in this example the knowledge base we work with. Each two nodes and the corresponding edge can also be referred to as a "triple"; this is the subject, predicate, object (SPO) structure familiar from natural languages. The graph shown contains 12 triples, since the arrows with two tips represent two directed edges and thus two predicates ("Max knows Ariela" and "Ariela knows Max").
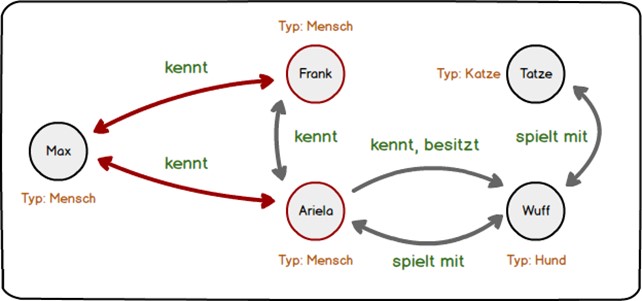
The question "Who does Max know?" can be answered by following the relation "knows" from the node "Max" and listing the nodes in the object position of the two triples: Frank and Ariela. The relevant edges and the result nodes are colored red.

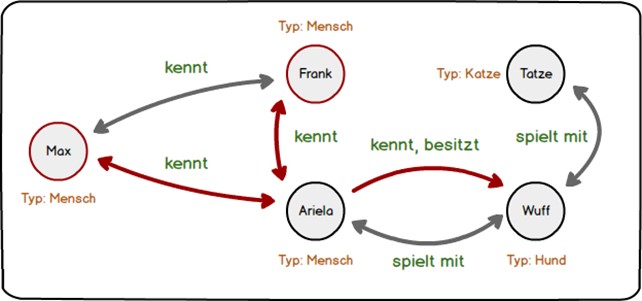
In the same way, a whole series of questions can be answered: Who knows someone who has a dog? (Frank, Max.) Who are Wuff's playmates? (Ariela, Tatze.) Is there anyone who knows three others? (No.) Whose dog plays with a cat? (Ariela.) By the way, the fact that every person also knows himself or herself, at least superficially, is not expressed in the graph; therefore, Ariela does not belong to the group of those who know someone who has a dog.

Graphs are often used to represent topographic networks such as roads, subway networks, utility lines, the physical lines of the Internet, and the like. In the first example above, that was the case. Here, edges are readily weighted to model flow rates or other properties of the respective links. Navigation systems are another good example here. As can be seen from the many references to the calculated routes, the route segments between start and destination are provided with a variety of properties that allow the overall route to be qualified afterwards: Are toll roads included? What is the average speed on this route? More or fewer turns? The "shortest path" algorithm, one of the best-known graph algorithms, is therefore not only provided with the pure route lengths, but also with the corresponding additional information or weights, so that in the end several "best paths" are calculated for me as a user, depending on my own preferences.
Schema freedom using graph database
In a relational database system such as Oracle or MySQL, a certain schema must be taken into account that specifies which data may be stored in a certain column. This restriction does not usually apply to a graph database, and this is a characteristic they share with the other large group of NoSQL databases, document databases. In both graph and document databases, the business logic of an application is usually responsible for determining which data types and which data structures may be used in the database - or for leaving this open.
Schema freedom initially provides good support for agile development methods. However, this aspect becomes particularly important when data from different sources is taken on board and their relationships are modeled.
The leading idea here is that data combined in this manner provides a context for each other that clarifies and expands the meaning of the respective data sets and thus increases the value of the information in the enterprise context: The whole is more than the sum of the parts - this is especially true for knowledge graphs, regardless of whether they organize world knowledge or link data within the enterprise.
Graph databases and visualization
Besides being schema-free and "emphasizing" relations, there is a third property of graphs that makes them valuable for knowledge organization inside and outside the enterprise. Graphs are great for visualizing relationships. When I visualize our company's customer graph, I can immediately see which customers are major "hubs" in their own right (resellers, vehicle builders), where small "islands" are, and who, if any, deals with customers or suppliers from different industries. For us (allsafe) this information helps us to better understand our market. Of course, calculated or derived information can in turn be represented as a graph, such as the similarities between texts in a corpus calculated using automatic methods. If you are looking for inspiration and information on the topic of graph visualization, you can have a look at the webseite of the US physicist and network researcher Albert Laszlo Barabasi or study the examples on the visualization .
Graph databases and information systems built on top of them, such as Databrain Sherlock, usually come on board with visualization tools that can be used to display the results of ad-hoc queries in order to answer a specific question or to familiarize oneself with a graph step by step. Although graph visualization with simulated attraction and repulsion forces has already established itself as a quasi-standard, there is a whole range of other very meaningful representation types that lend themselves to visualization depending on the use case, including chord diagrams the so-called „Hierarchical Edge Bundling“.

The analytical value of a graph database
On April 3, 2016, the so-called Panama Papers became public. 2.6 terabytes (11.5 million documents) of confidential records of a Panamanian offshore service provider were made accessible with the help of graph databases, thus revealing ownership structures, money flows, tax avoidance strategies of more than 214,000 shell companies and thousands of individuals involved. The analytical value of a graph is obvious in this use case. The question "Who is behind this?" can only be answered for such a corpus of documents with the help of queries across multiple nodes, and for this a graph model cannot be beaten in terms of flexibility and efficiency.
At allsafe we are currently working on our own software for strategic market cultivation that links sales data and customer master data from the ERP with other data sources, including external data sources, results of machine learning algorithms or data from other internal systems. It is surprising how meaningful our master data suddenly becomes when it is enriched in this way, making new queries possible.
In the case of our project, more data will be added over time, such as usage data of our products in the field. New data and relations, including those with new semantics, can be added to the database on the fly, and each new "layer" increases the analytical value of the information already entered. What emerges here is an "Enterprise Knowledge Graph", whereby the acronym "ECG" is of course only coincidentally reminiscent of medical diagnostics.
Such an enterprise knowledge graph is usually application-oriented, even if the multiple use of the graph, controlled by application-specific queries, is already designed in the graph model and explicitly desired from an organizational point of view. In contrast, formal ontologies and open semantic data collections such as DBPedia or Wikidata do not serve a predefined (corporate or organizational) purpose; they are to be understood as an "open source" variant of a Knowledge Graph whose usage patterns are not yet fixed at the time of creation and which organize "world knowledge" instead of handling company-specific information.
However, the analytical value of graphs and graph databases is by no means exhausted by meaningful queries on cleverly curated knowledge graphs. A Gartner–study predicts the following:
"Graph technologies will be used in 80% of all data and analytics innovations in 2025 - up from 10% in 2021 - enabling rapid decision making across the enterprise."
What the future holds
We are talking about innovation here. It is likely that hybrid methods will be used to combine graph technologies and other ML or AI technologies. It will be worthwhile to take a look at existing approaches trying their hand at this "combinatorics".
As described earlier, a graph can also be thought of as a collection of "triples" or statements of the form subject-predicate-object. In this sense, AI projects in the context of graphs can first be classified as symbolic AI. The sample graph above can be used to check statements for their truth value such as "There is no one who owns a cat". More complex graphs in combination with rules can lead to further and especially not immediately readable conclusions.
A common use of graphs in this form concerns the output of image or text recognition algorithms. The sentence "Udo Samel learned his profession at the drama school in Frankfurt am Main starting in 1974, after studying Slavic studies and philosophy at the Goethe University in Frankfurt for one year" can, after a semantic analysis, be transformed into a graph that links the person "Udo Samel" with the institutions "drama school" and "Goethe University", these in turn with the city "Frankfurt am Main" and with the subjects "Slavic studies" and "Philsophy". Based on the rules, it can be concluded that Udo Samel learned the profession of an actor - the "profession" is mentioned in the sentence, and this is exactly the profession that one learns at an acting school.
Analogously, the results of image recognition algorithms can also be stored in the form of a graph for further use and, conversely, already existing triples can be used, for example, for plausibility checks of image recognition.

Graph Embeddings
In automatic language processing, so-called "word embeddings" have proven to be a helpful method for many problems. Word embeddings place words in a multidimensional vector space, usually in such a way that words with similar meanings are closer together.
So-called "graph embeddings" can be created in a similar way. As explained above, graphs can be interpreted as collections of triples, which can be used for knowledge representation and knowledge processing ("reasoning"), i.e. for rule-based derivation of new triples. Graph embeddings now solve the problem of how to move from symbolic AI (logic) to numerical methods in the domain of graphs. Nodes become multidimensional vectors (similar to words in word embeddings), in such a way that their edges as well as the properties of their neighboring nodes are also encoded in the vector. In this way, a vector space is assigned to the original graph in which the nodes are arranged including their surrounding properties. In this way, a similarity measure can be specified in a further step, which makes the nodes numerically comparable with each other - the same cannot be achieved with query languages based on symbolic logic.
Graph Neural Network (GNN)
Generally speaking, a GNN is an artificial neural network that processes data which can be represented in the form of a graph. As in other topics of "Deep Learning" or more precisely "Geometric Deep Learning", decisive progress has been made in recent years.
The "design principle" of a GNN is the pairwise exchange of messages between nodes, which is why GNNs are considered a type of Message Passing Neural Networks (MPNN). With the help of information exchange with neighboring nodes, nodes gradually modify their own representations.
GNNs are used in combinatorial optimization (e.g., finding shortest paths) and for social network evaluation, such as for recommender systems. However, the most spectacular use case in recent years may be AlphaFold, the program that enabled the company Deepmind, in collaboration with EMBL-EBI, to predict the folding of a protein in a manageable amount of time from its amino acid sequence. The program has caused quite a stir and won the CASP competition, which evaluates techniques for predicting protein structures, in two version stages, in 2018 and 2020 respectively. This is important in part because of the approximately 200 million proteins found in nature, the specific structure is known for only about 170000, or less than 1%. AlphaFold is trained with these known proteins and then predicts with remarkable accuracy the concrete folding, i.e. the arrangement of the amino acids in space, of proteins that have not yet been studied.
In principle, however, an "analytical quantum leap" can be expected for still quite different data that lend themselves to representation as a graph through the use of graph embeddings and GNNs - or through methods that are not even known today. As said, in 80% of all innovations in data processing Gartner expects the participation of graph technologies of one form or another already in 3 years, and a not too small part of it might have to do with a combination of symbolic and numeric methods.
At what point are graph databases suitable?
So when is a graph database or software based on it, such as the Informationsystem Sherlock a good fit for an existing business problem? As of today, the following points can serve as a rule of thumb:
- The data has many relationships, so it is highly interconnected.
- A flexible data schema is desired or even necessary.
- Enrichment by newly added information is intended.
- The queries to be executed should be able to integrate information from different sources.
- The queries should be fast and make complex patterns in the data and their relationships visible.
- The use of graph embeddings or graph neural networks seems promising.
Learn more about Databrain Sherlock!
Christoph Pingel is Head of Software Development at allsafe GmbH & Co. KG. Allsafe is an internationally active company in cargo securing. With 250 employees and products in 10,000 variants, allsafe ensures safe transport, whether by road, air or sea. A long-time customer of Fischer, allsafe successfully uses Databrain Sherlock to access all data across all source systems through a unified interface, enabling them to implement digital business models with minimal development effort. Read more about the allsafe & Sherlock success story here.


